

Content
By: Dan Bath
From 3D scanning to spectral analysis and artificial intelligence, Vineland is developing new ways to measure, understand and evaluate plants — opening new possibilities for horticultural research and innovation.
How do you measure the quality of a plant? Its height, shape, colour, vigour and overall appearance can tell us a great deal about its health and performance. But obtaining these measurements is not always straightforward.
Traditional plant evaluations often rely on manual measurements, visual assessments and, in some cases, destructive sampling. These methods can be labour-intensive, subjective and limited in the information they provide.
At Vineland Research and Innovation Centre (Vineland), we’re exploring a different approach.
Content
By combining advanced imaging technologies, spectroscopy and artificial intelligence (AI), we’re developing new methods to capture detailed, objective information about plants. These emerging digital phenotyping tools are allowing us to measure characteristics that were previously difficult or impractical to quantify, while creating opportunities for entirely new types of analysis.
A New Dimension in Plant Evaluation: 3D Scanning
Imagine being able to capture the complete three-dimensional structure of a plant in less than two minutes, without damaging it, and then use that digital reconstruction to measure its size, shape and growth.
That’s what we’re working on at Vineland.
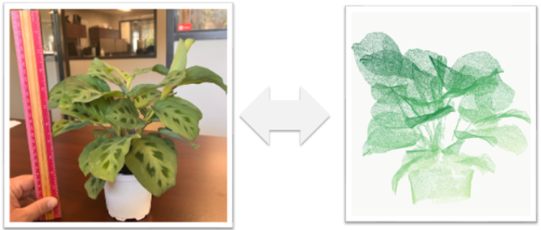
Using advanced 3D scanning technology, we generate detailed digital representations of plants, known as point clouds. These contain millions of spatial measurements describing the plant’s visible surfaces and structure.
From these digital models, we can extract a wealth of quantitative information, including plant height, width, volume, surface area and the spatial distribution of plant material.
A more predictive future for crop protection
Using advanced 3D scanning technology, we generate detailed digital representations of plants, known as point clouds. These contain millions of spatial measurements describing the plant’s visible surfaces and structure.
From these digital models, we can extract a wealth of quantitative information, including plant height, width, volume, surface area and the spatial distribution of plant material.
Image Text
Unlike conventional measurements that might capture only a plant’s height or maximum width, 3D scanning provides a much richer picture of its architecture.
And because scanning is non-destructive, we can return to the same plant repeatedly to observe how its structure changes throughout its development.
This is particularly valuable for variety evaluations, crop research and studies involving growth, environmental stress or treatment responses.
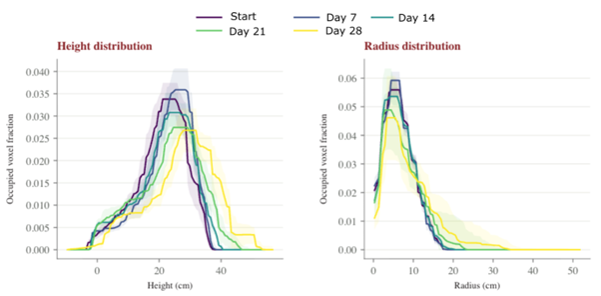
Image Text
Teaching AI to Recognize Plant Structures
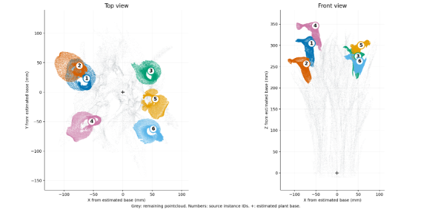
Capturing a 3D model is only the beginning. We’re also developing AI-based approaches that can interpret these models and identify individual plant structures.
Content
In a recent proof-of-concept study involving calla lilies, Vineland researchers trained a machine-learning model to recognize and distinguish individual spathes — the colourful, leaf-like structures (they look like flowers, but they’re technically not!) — within complex 3D plant scans.
Remarkably, the model uses geometric information alone. It learns to recognize plant structures from their shapes and spatial relationships, without needing colour information. Once identified, these individual structures can be counted and evaluated for characteristics such as their size, position, height and surface geometry.
Although the technology is still being refined, the implications are exciting. Similar approaches could eventually allow us to automatically identify leaves, stems, flowers and fruit, enabling much more detailed assessments of plant growth and development.
Rather than simply asking whether one plant is taller than another, we can investigate how its leaves are distributed, how its reproductive structures develop, or how its overall architecture changes over time. More detailed information about how plants are growing gives better understanding of how plants are affected by their environment, genetics, pathogens, nutrients, and more.
These are the kinds of measurements that can help researchers and breeders uncover differences that conventional evaluations might miss.
Beyond What the Eye Can See: Spectrometry for Colour and Plant Health
Plant colour provides important clues about quality, development and physiological condition. Yet colour evaluations are often surprisingly subjective.
Two observers may describe the same plant differently, and subtle changes can be difficult to detect consistently under varying lighting conditions.
Spectrometry offers a more objective alternative.
A spectrometer measures how plants reflect light across different wavelengths, producing a detailed spectral signature. Rather than simply recording what colour a plant appears to be, this technique captures information about how its tissues interact with light.
At Vineland, we’re applying this technology to develop quantitative methods for evaluating plant colour and investigating the biological factors underlying its appearance.
Measuring Colour and Understanding Pigments
In a recent ornamental plant evaluation, we used reflectance spectroscopy to precisely characterize colour differences and track how colours changed over time.
By converting spectral measurements into standardized colour coordinates, we can objectively compare plant varieties and quantify even subtle shifts in appearance.
But we can go a step further.
Content
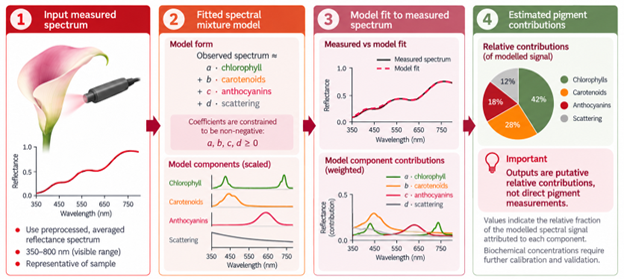
Different plant pigments, including chlorophylls, carotenoids and anthocyanins, absorb and reflect light in characteristic ways. By analysing spectral signatures using computational models, we can estimate the relative contributions of these pigments to a plant’s appearance.
This approach, known as spectral unmixing, offers a promising new way to investigate changes in pigmentation without necessarily destroying plant tissue for laboratory analysis.
While these pigment estimates are indirect and require validation for specific applications, they can provide valuable insights into processes such as colour development, fading and regreening.
For breeders and growers, this could mean more consistent evaluations of ornamental quality and a better understanding of why plant colours change during production, shipping, retail display or storage.
Looking beyond colour, the opportunities extend well beyond the colours we can see. Plants interact with light across a broad range of wavelengths, including the near-infrared and shortwave-infrared regions of the spectrum.
These wavelengths can provide information related to leaf chemistry, water content, tissue structure and physiological condition — characteristics that may not be apparent through visual inspection alone.
By combining spectral measurements with suitable analytical models, researchers can investigate plant responses to environmental stress, nutrient availability and disease.
This opens opportunities for earlier detection of plant-health problems, more objective comparisons between treatments, and the development of new monitoring technologies.
The goal isn’t simply to replace visual observations. It’s to reveal information that our eyes cannot detect.
Innovation Starts with a Question
At Vineland, we’re excited about what these technologies can already accomplish, but we’re even more interested in what they could make possible next.
Many of the methods described here are still being developed, tested and refined. They represent an expanding set of capabilities rather than a fixed catalogue of services.
And that’s an important distinction.
We want to hear about it.
Our team brings together expertise in horticulture, plant science, optical technologies, computer vision, AI and data analysis. We enjoy working with industry partners to adapt existing tools, develop new measurement techniques and explore unconventional approaches to challenging research questions.
You don’t need to know which technology might solve your problem. That’s something we can investigate together.
Have a plant-related challenge that could benefit from a fresh perspective? Let’s explore what’s possible.
Connect with our team of experts, to discuss how we can work together to develop the next generation of digital tools for horticulture.